Making the best use of the available breakpoints
The concept of a breakpoint is very simple since it only interrupts the execution of a program right before a specified instruction. The implementation can be in hardware or software but this will not be discussed here. Being simple doesn’t mean that it can’t be used in complex combinations that can solve a bug in an easy way. The fact is that software developers cannot live without breakpoints, but how to make the best use of them?
In IAR Embedded Workbench, we have the possibility to use the following breakpoints:
- Code breakpoints
- Conditional code breakpoints
- Data breakpoints with read and write access
- Data Log breakpoints
- Log breakpoints
- Power breakpoints
- Trace Start and Stop breakpoints
This text will try to give the best hints on how to debug your application faster and make use of each one of the available breakpoints.
Code breakpoints
This is the simplest use of a breakpoint. You only need to choose the C line or the ASM instruction in the disassembly windows and toggle the breakpoint. Once the breakpoint is hit, your application will stop. At this time, you can check the values of variables, flags and registers. In other words, you have full control.
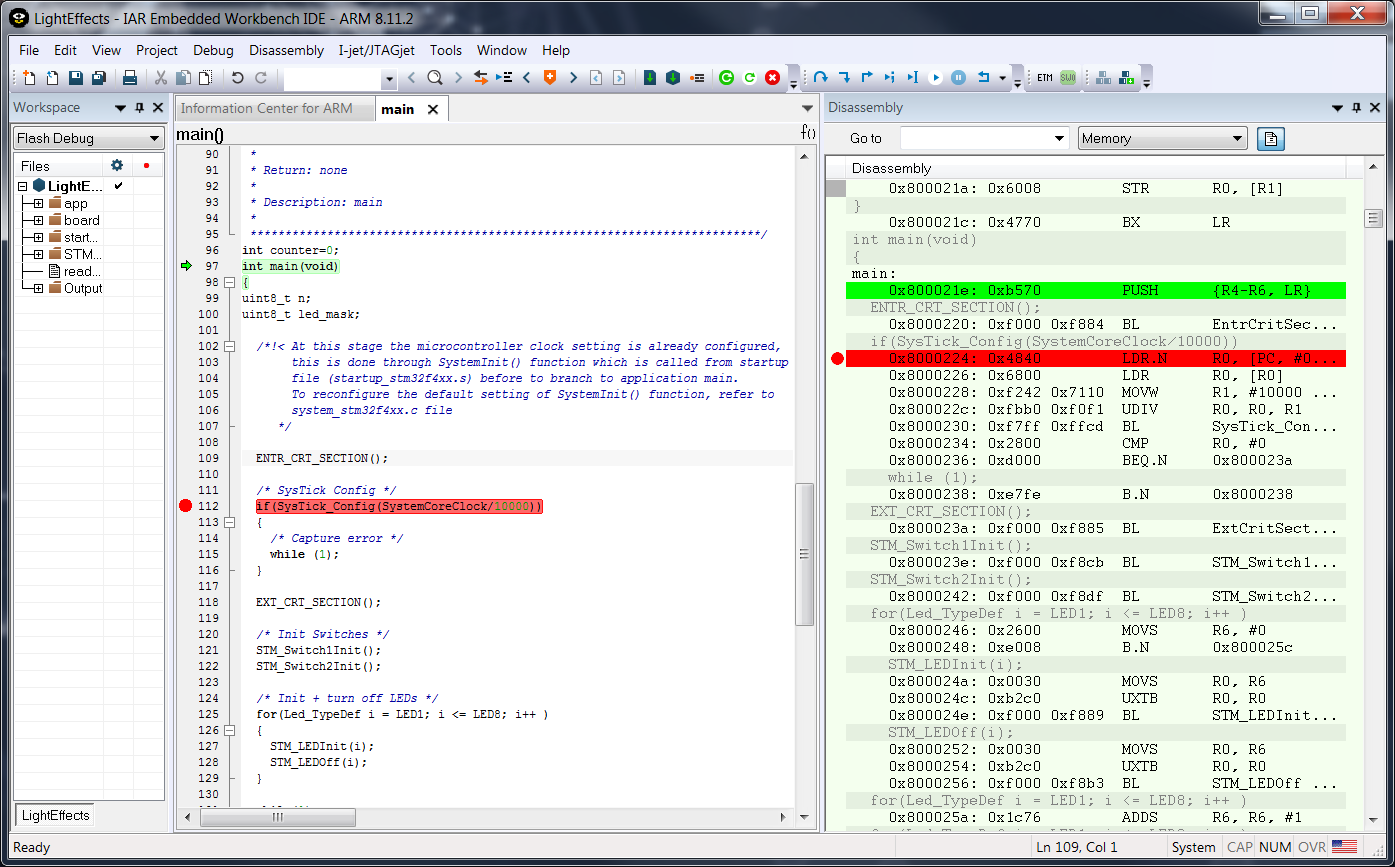
The number of code breakpoints is limited to the number of hardware breakpoints but can be unlimited if you make use of software breakpoints or run the application in RAM. Even with a limited number, for example for Arm Cortex-M where we have 6-8 breakpoints, you could save the location and disable and enable the breakpoint when needed. Just choose to show the View ->Breakpoints window and you will be able to set/clear the box, which means enabling or disabling the breakpoint.
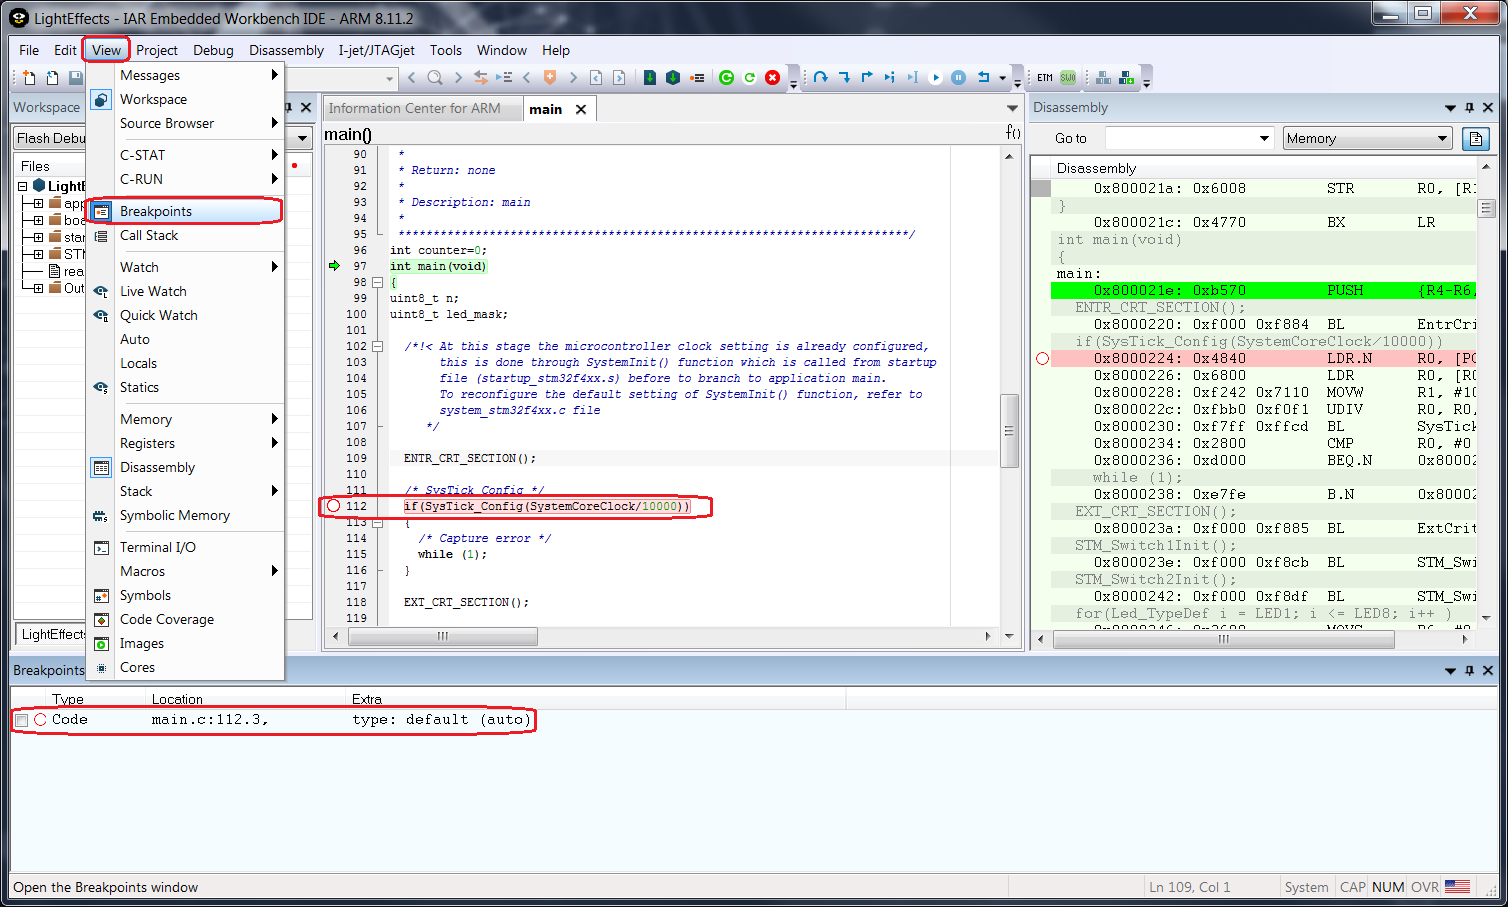
In this case, you can have more than 6-8 breakpoints but not all active at the same time.
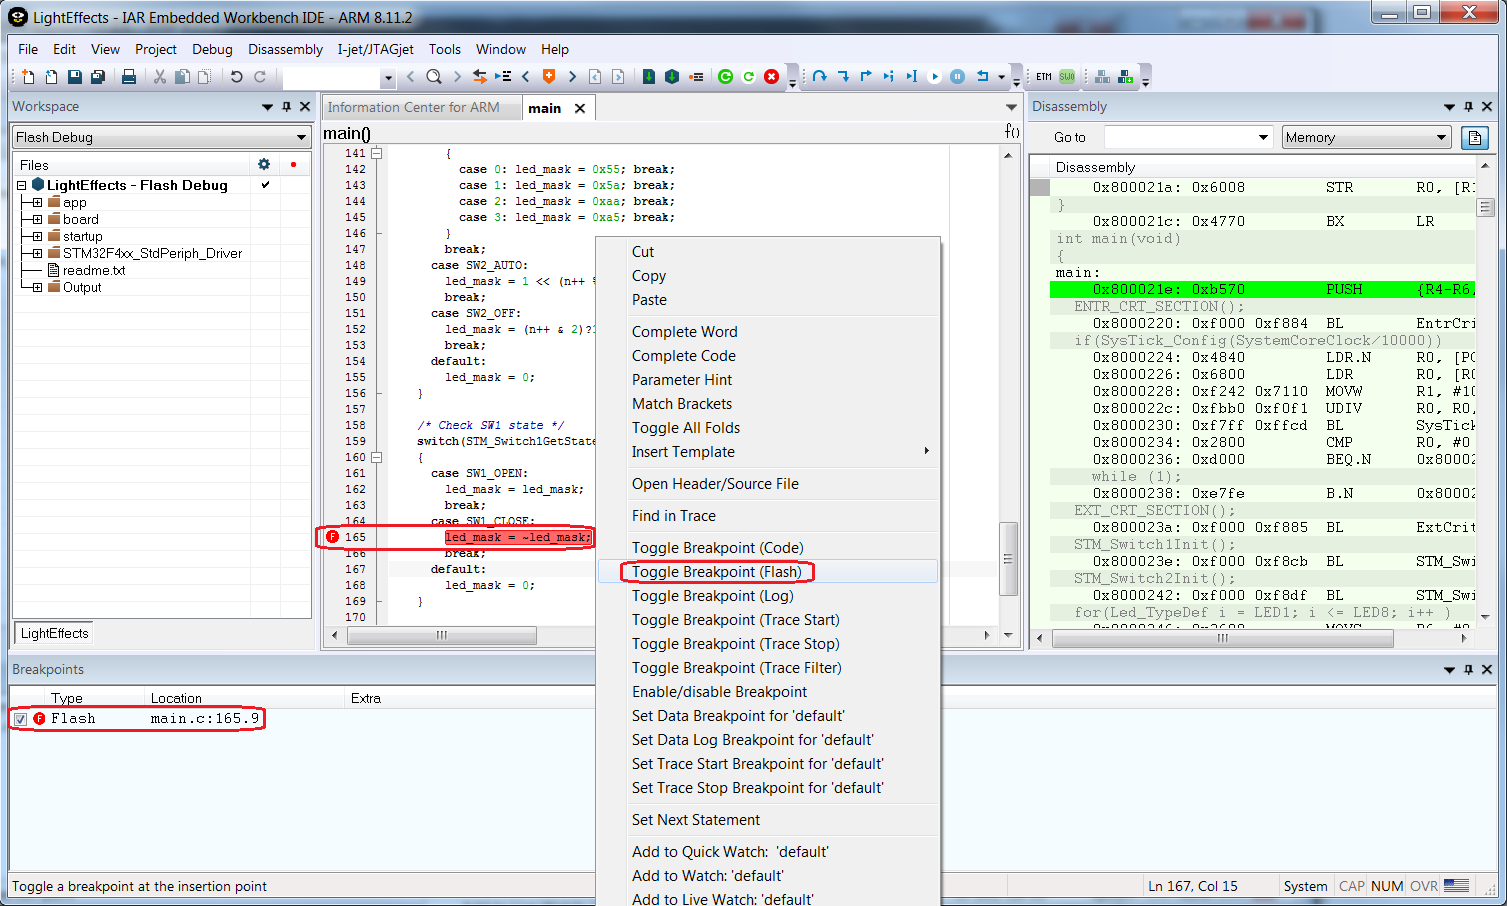
By default, the IDE will set code breakpoints. If you have an I-jet debug probe you can explicitly choose a flash breakpoint when right clicking on the line of code. This is useful if you already made use of all the existing hardware breakpoints. Notice the “F” in the breakpoint symbol. The flash breakpoints feature is available in version 7.60 or later of IAR Embedded Workbench for Arm.
Conditional Code breakpoints
A conditional breakpoint is the combination of a code breakpoint with some flag or variable as a condition. Once a breakpoint is set, you can again use the View ->Breakpoints window to see all breakpoints, but also set extra parameters by right clicking and select Edit option.
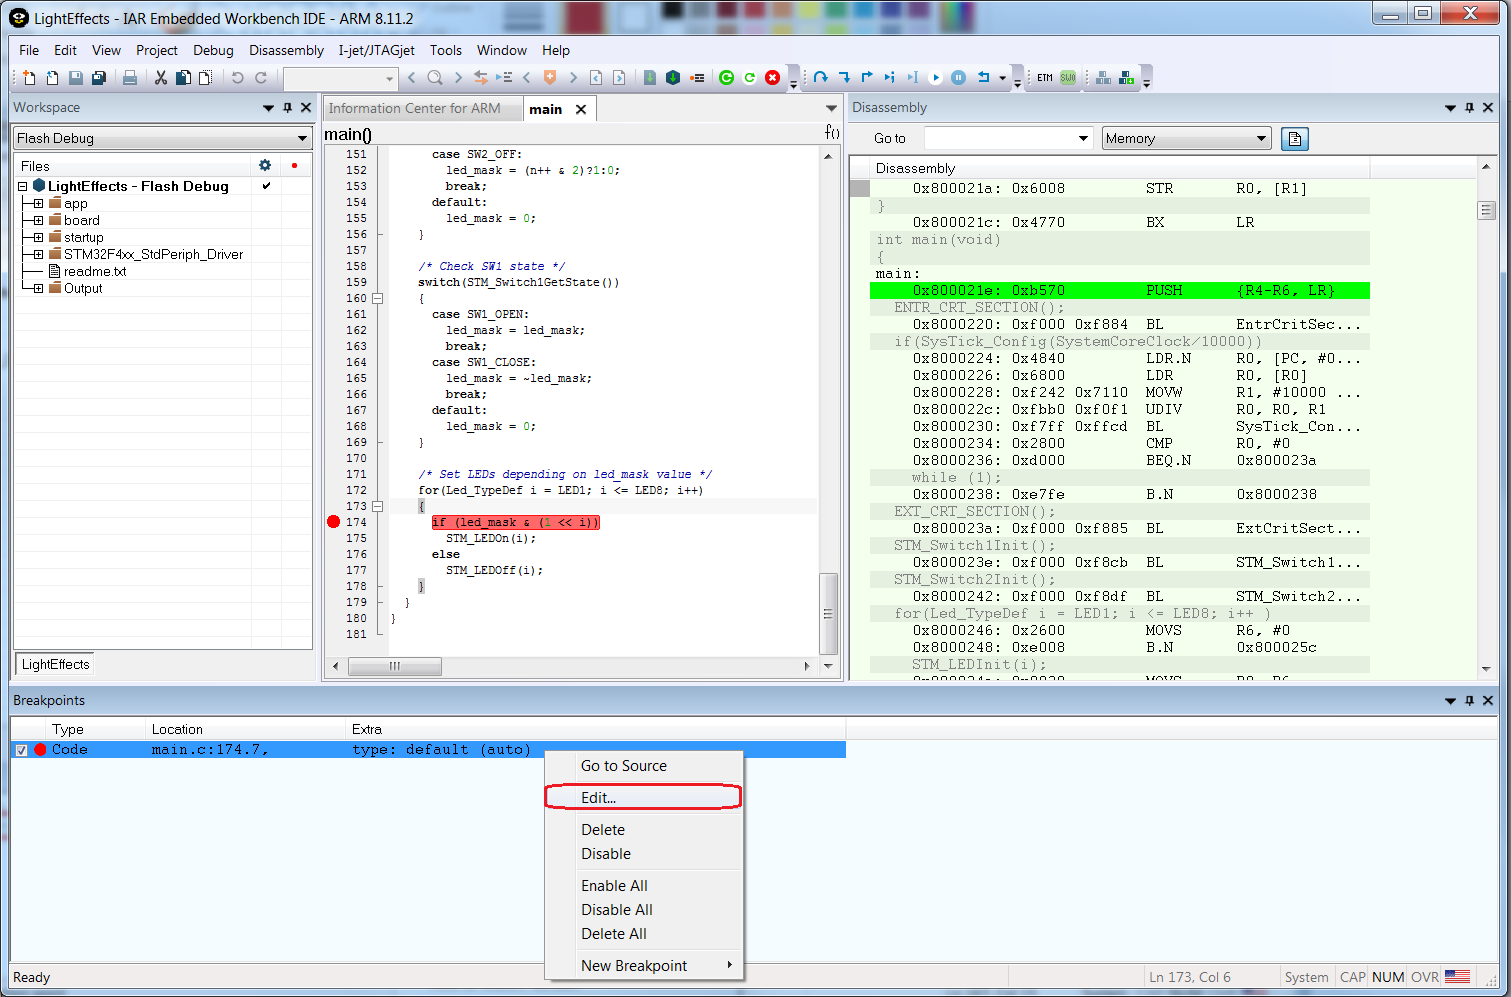
The syntax to be used is similar to the C syntax and you can use ==, >= and <=. For example, if you want the application to halt at the breakpoint when the counter is equal to 10, you use “counter==10”.
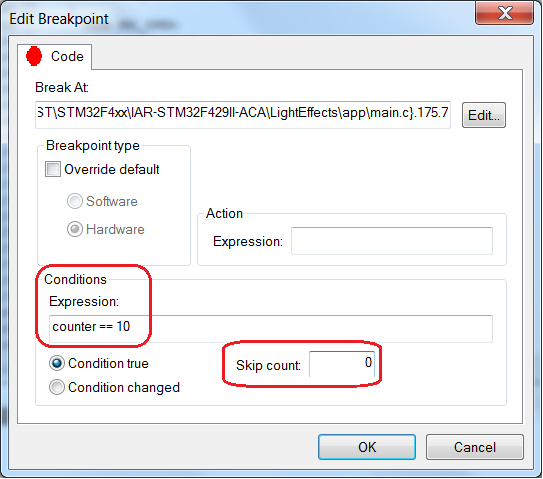
This is very useful when a breakpoint is needed inside an interrupt routine. Without a condition, it would be impossible to debug your application since it would halt all the time. Using a flag or variable as a condition makes things much easier. You can also go a bit further using the skip counter and a condition check like true or changed.
Data breakpoints with read and write access
Data breakpoints are a bit different compared to other breakpoints since they monitor the read and write access to a specific memory address, flag, variable or register. Using this breakpoint is very straightforward. Simply right-click the flag or variable and select the option Set data Breakpoint. By default, the read and write accesses will be monitored. If you want to add extra setting you can do it through the View->Breakpoints window and Edit option. Aside from the accesses, it is possible to monitor if the data matches. This means that the write or read access would only trigger the halt if the data matches. By choosing the Edit button, you open an extra window that makes it possible to select absolute addresses or even a source line. In case of a variable or flag, it is recommended to use the auto size. If a bigger range needs to be monitored, the manual size should be used with the desired size.
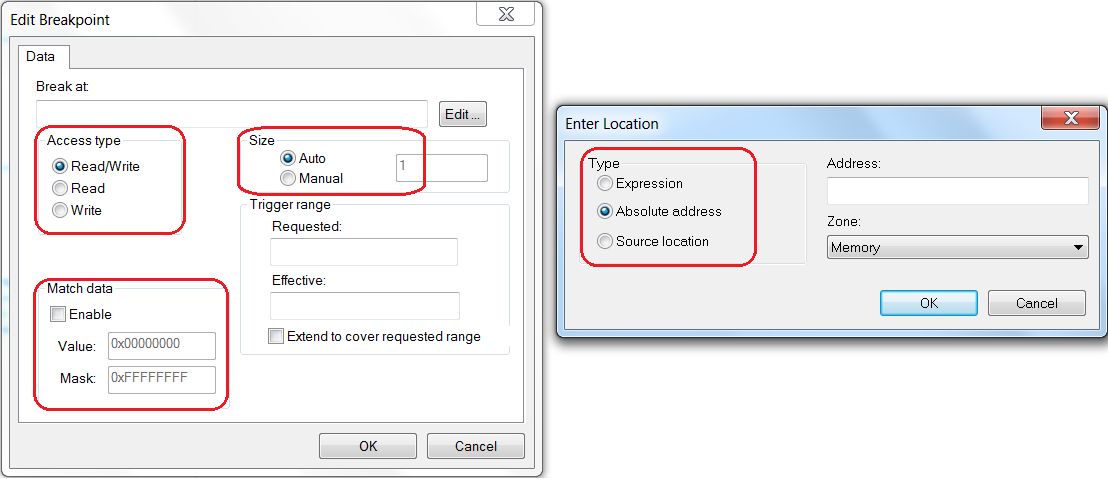
The data breakpoint is very useful to debug flags and variables that are being corrupted by the application. Once there is some access the application halts. Another approach is the stack overflow investigation. Just set a data breakpoint at 80-90% of the stack size and when the overflow is near, you can halt the application and go step by step to find the root of the problem.
Data Log Breakpoints
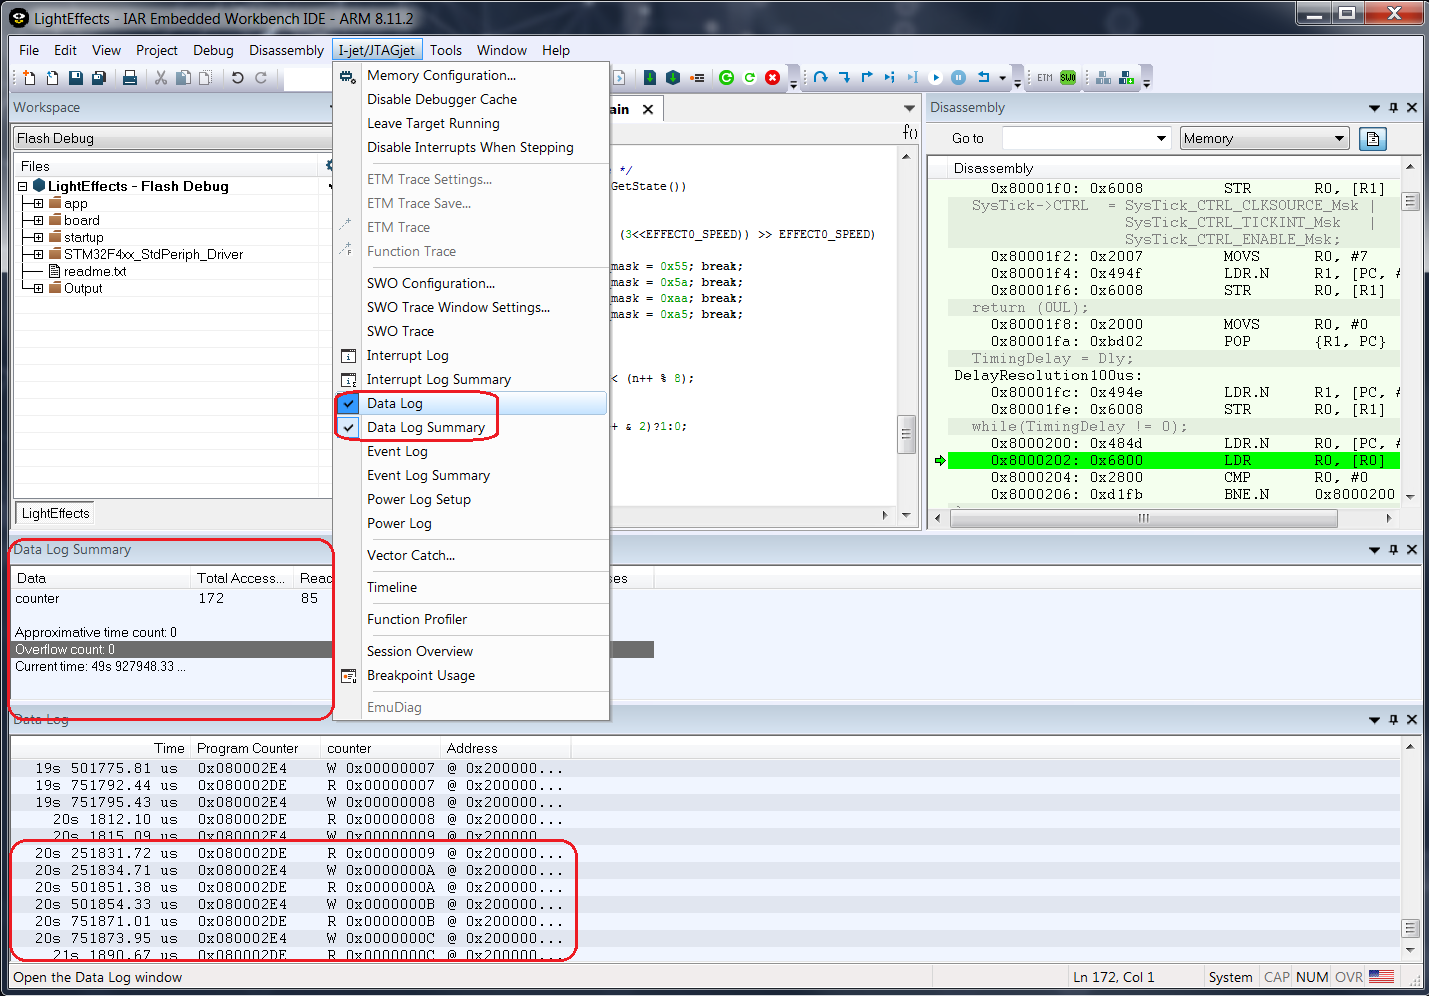
In addition to data breakpoints with read and write accesses, you can also use data log breakpoints. The idea with these is to monitor and plot graphically the value of a specific variable or address in memory in the timeline. This makes it easy to compare two or more variables and consider the time variant or some interrupts that are being triggered.
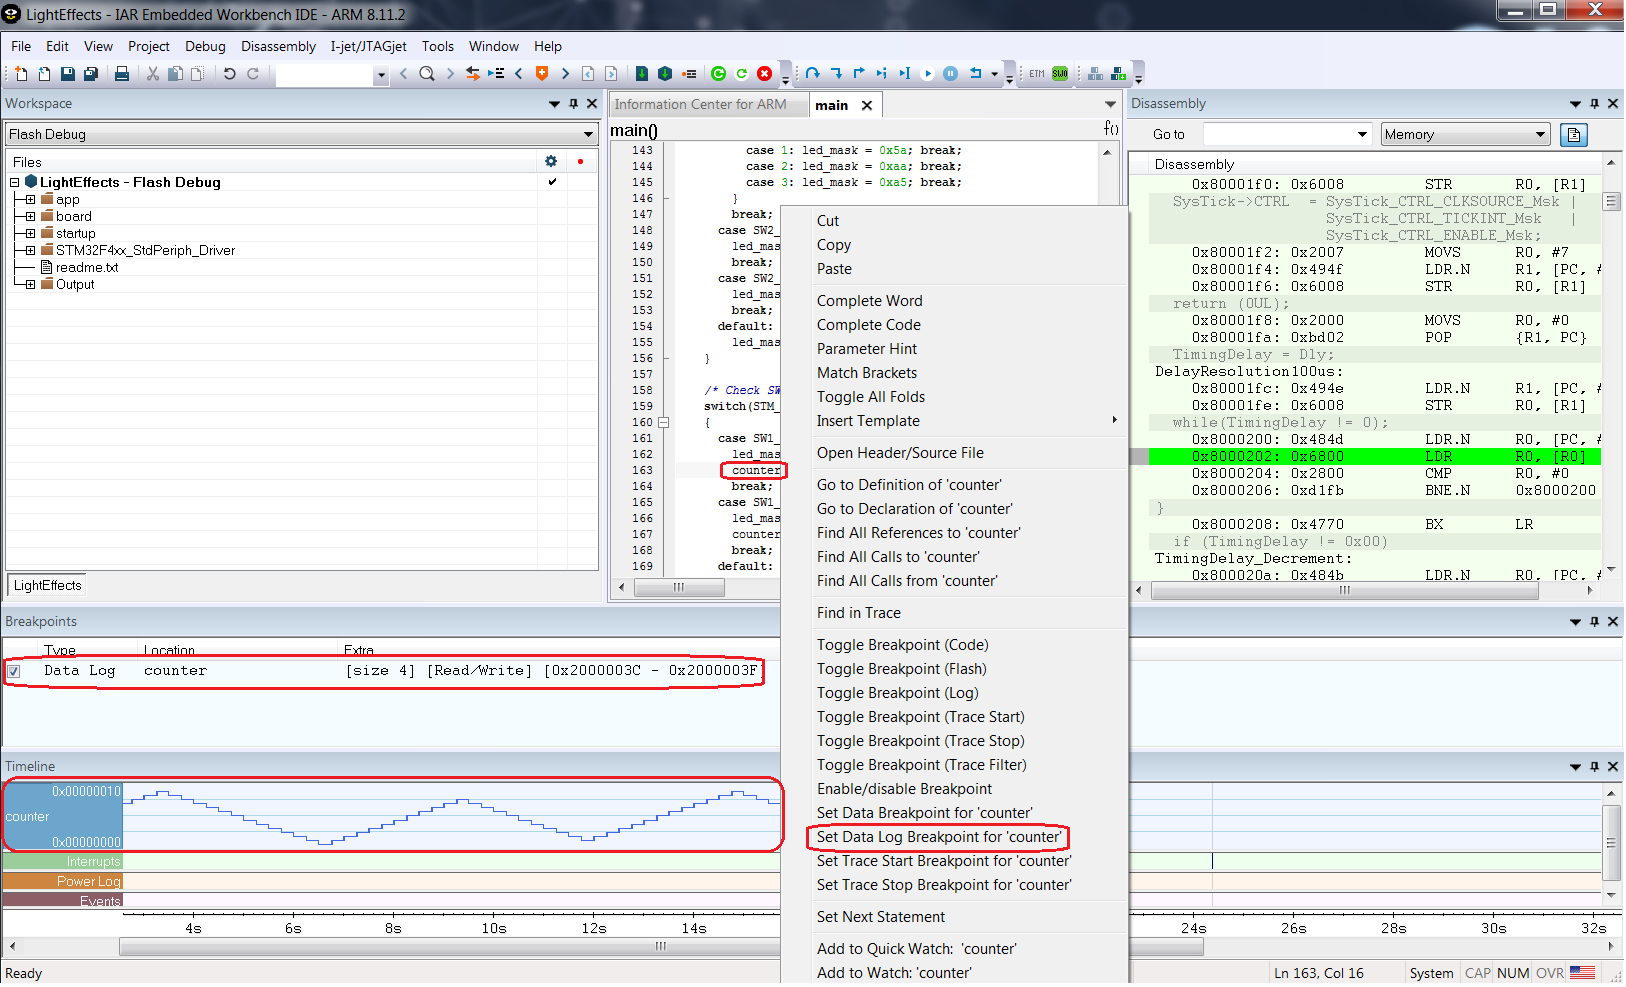
The timeline and the additional data log and data log summary are available under the probe options, for example as seen in the screenshot below.
Log Breakpoints
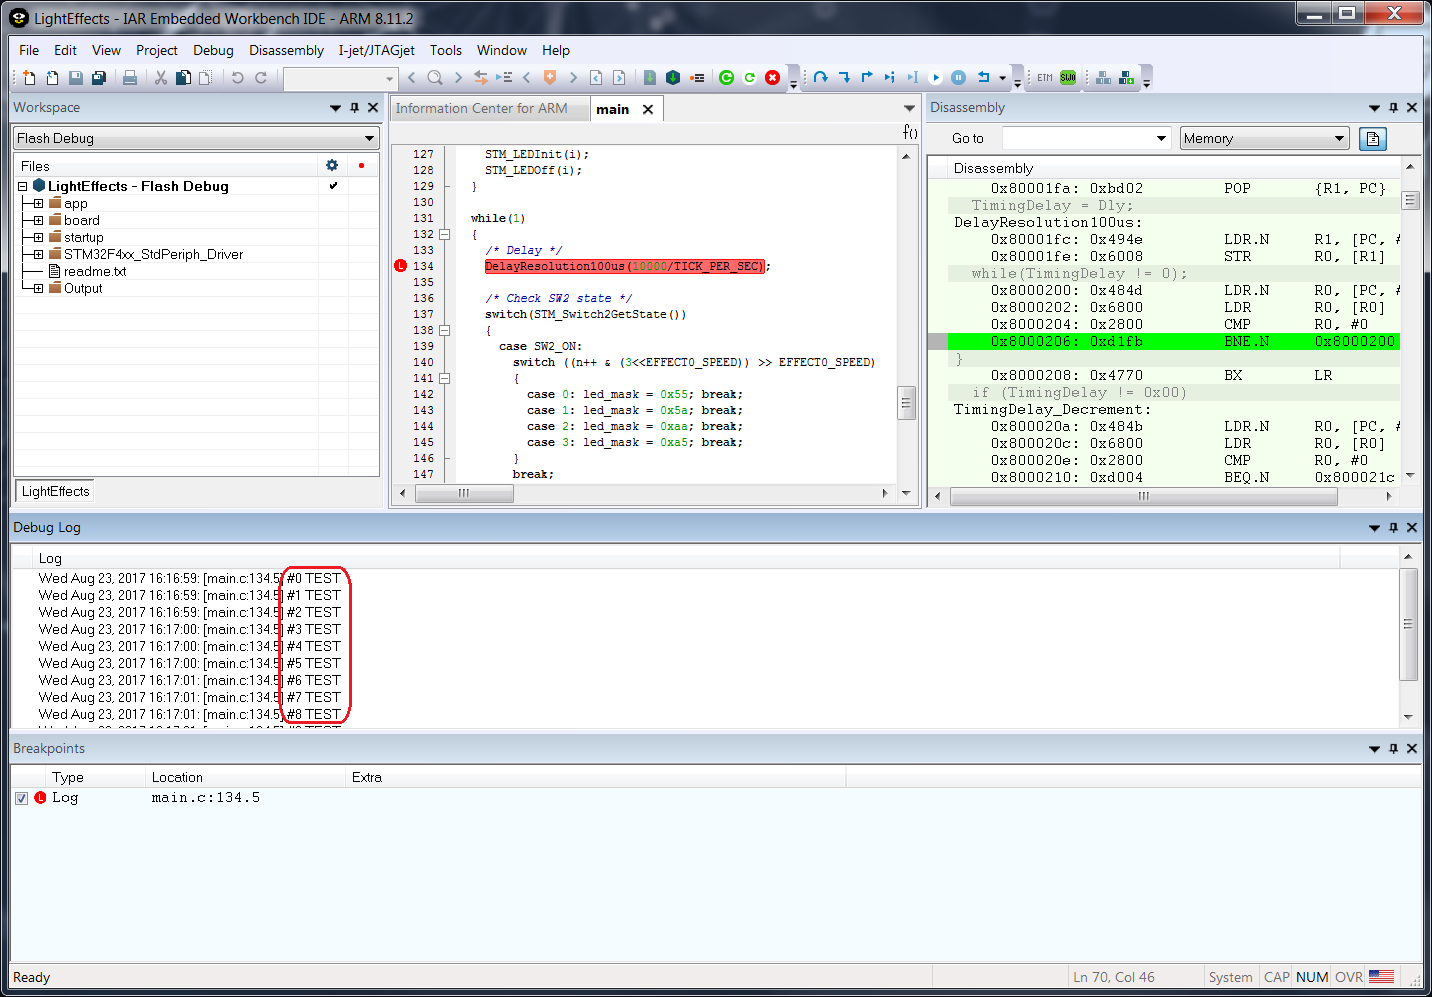
Aside from the code and data breakpoints, you also have the log breakpoints. This is a special breakpoint since it will only temporarily halt the application to print a message. It will only show the selected message once the breakpoint is hit.
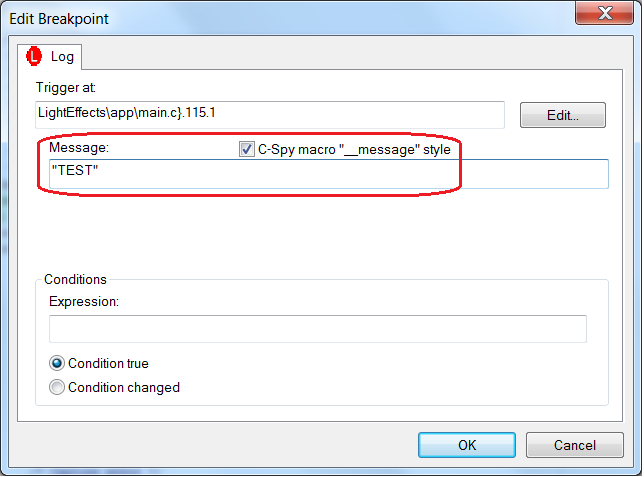
Every time the breakpoint is hit, a message will be displayed in the debug log window. An added counter makes it is possible to know how many times the application passed that part of the source code.
Power breakpoints
Thanks to the power debugging technology in IAR Embedded Workbench, you can monitor the energy consumption and correlate it with the source code. This makes it possible to know the energy consumption of the entire application. This concept also makes it possible to add power breakpoints. It is possible to set a threshold, like 25mA, and the debugger will halt once the energy is above this value.
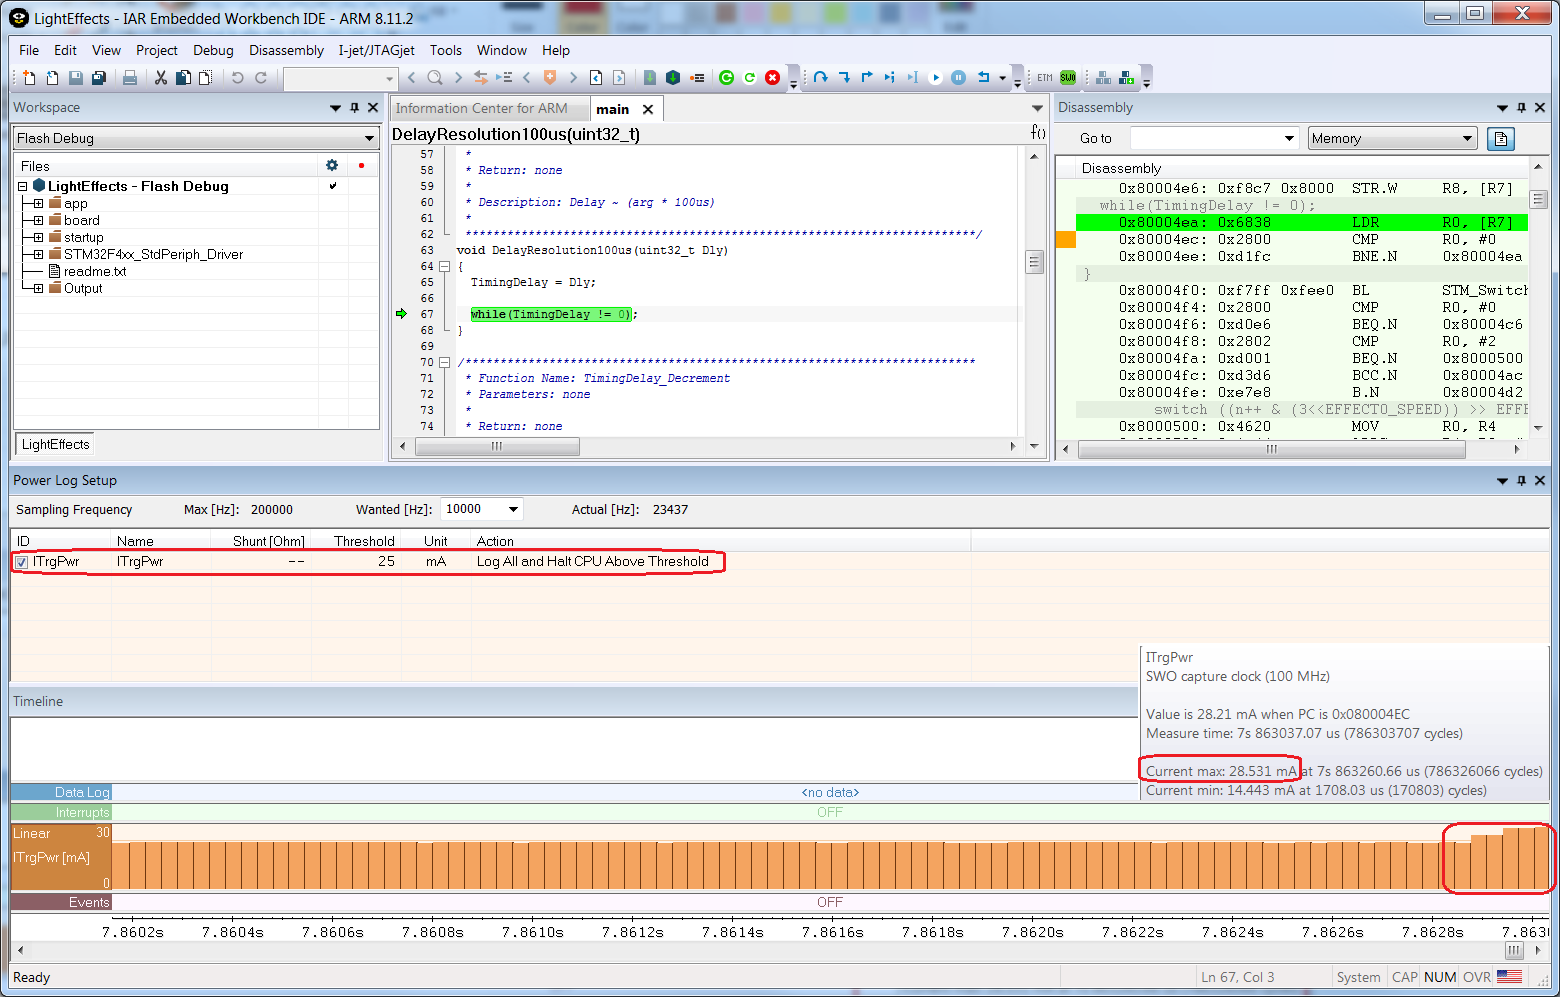
Setting the threshold is very simple. You only need to open the I-jet->PowerLog window and then set the value and desired option as shown above or below the value.
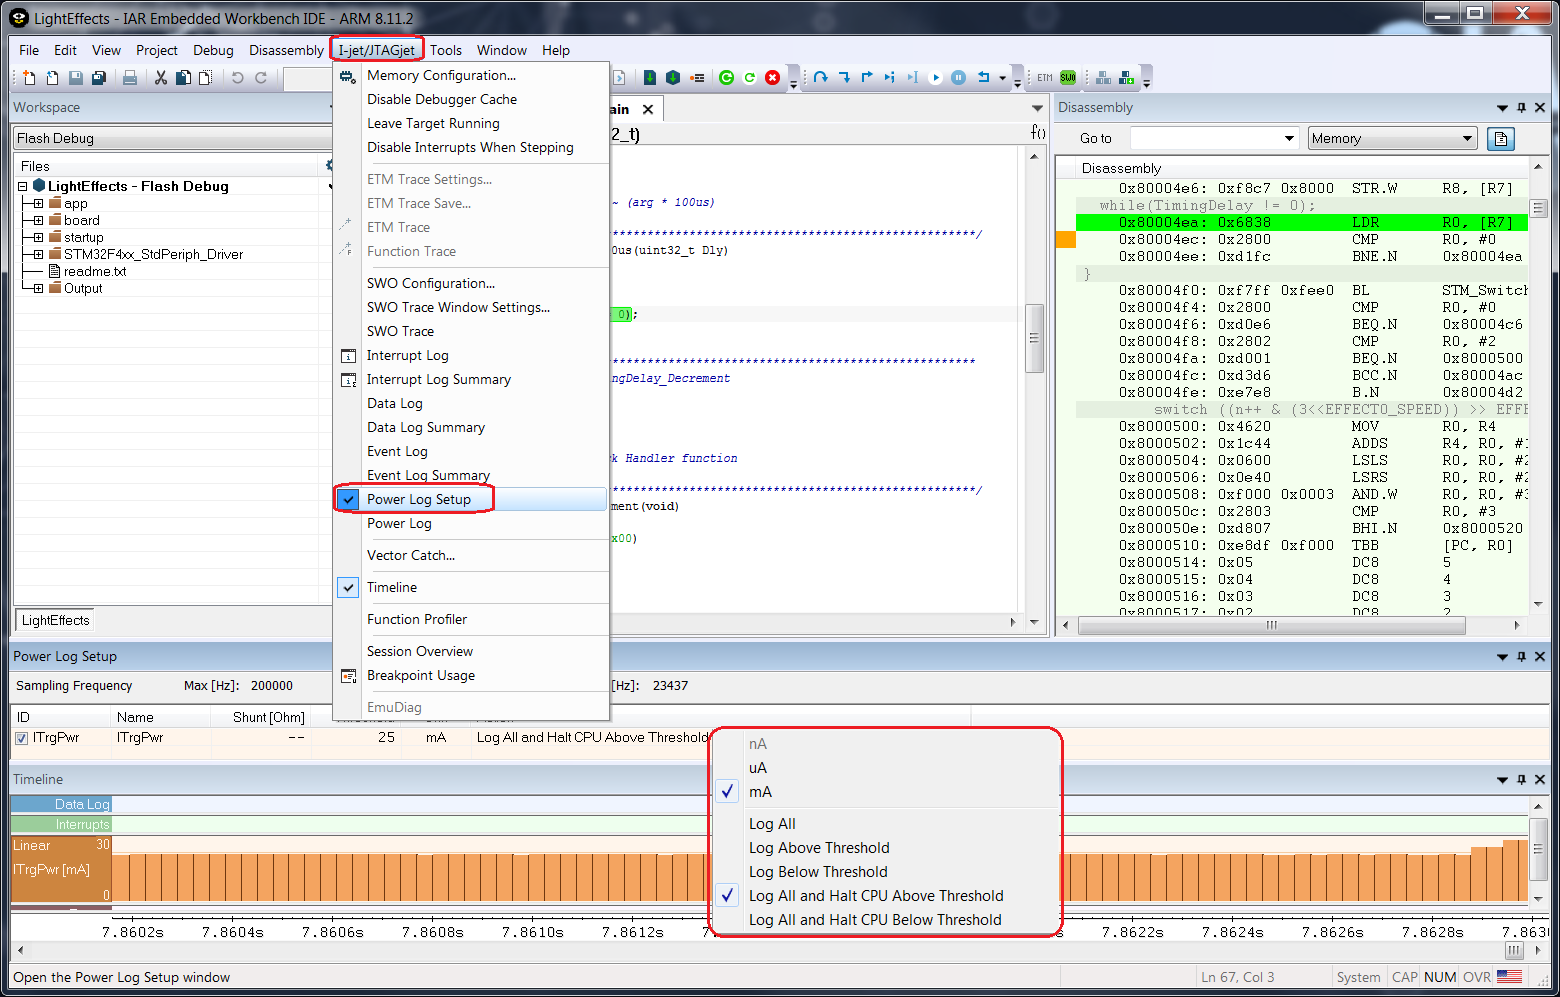
The feature is useful to guarantee to not have any peaks of power consumption or higher values than specified, and the battery will last longer with this kind of analysis. You can just leave your application running for a long period of time. The timeline window is not necessary but it gives you the complete information about the energy that is being used.
Trace Start and Stop breakpoints
The last breakpoints that I would like to point out are the trace start and stop breakpoints. These are possible to take advantage if you have access to an advanced trace probe, like I-jet Trace for Arm Cortex-M or I-jet Trace for Cortex-A/R/M. This is especially useful when trying to analyze a reduced part of the application. The usage of trace start and trace stop breakpoints is straightforward and the only think you need to do is to right-click in the lines of the source code and decide where the trace should start and end. The trace buffer will only have the instructions between the desired lines of code in the application.
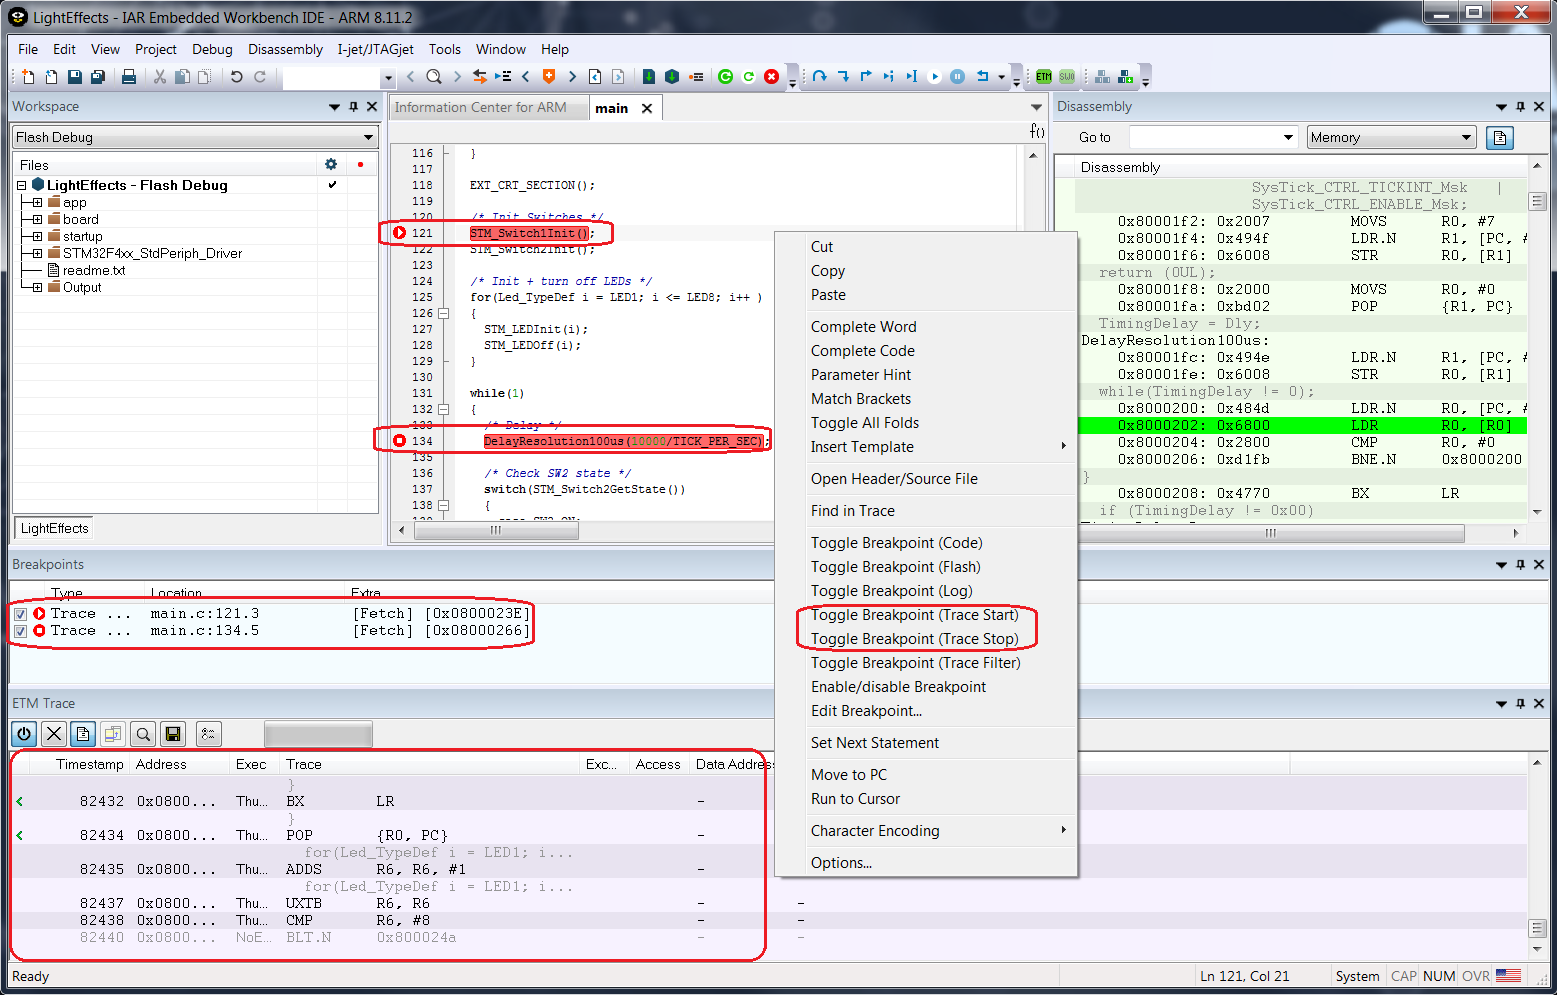
You can also have a graphical overview of the call stack from the trace instructions in the timeline that have been captured between the trace start and stop breakpoints.
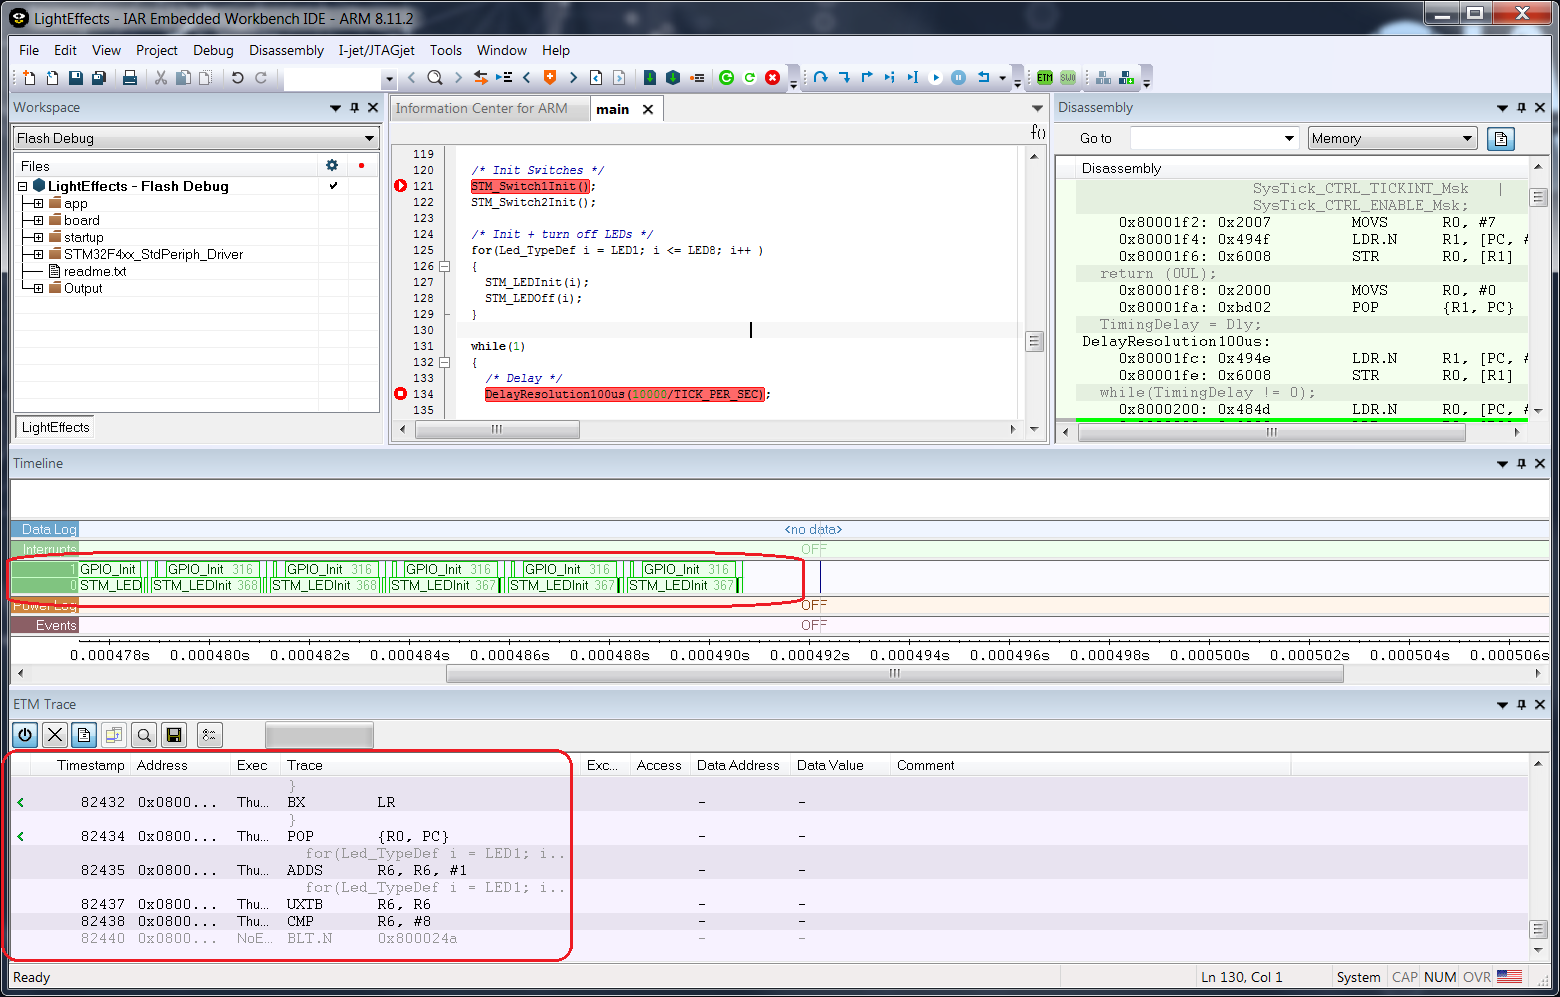
A trace probe, like I-jet Trace, is always more powerful than a standard JTAG/SWD probe but sometimes it can become tricky to interpret all the information correctly. In order to avoid collecting millions of unnecessary instructions and make the debug with trace straightforward, IAR Embedded Workbench offers the capability of start and stop trace breakpoints.