ARM Cortex-M Debugging
The ARM Cortex-M family of microcontrollers adds several advanced debugging features that were not available in previous ARM microcontrollers or their competitors. The serial wire debug, or SWD, interface provides access to features of the CoreSight debug infrastructure such as time-stamping and event tracing such as interrupts. This article will address how to use interrupt logging in the IAR Embedded Workbench debugger.
To open the interrupt log window, select interrupt log from the C-SPY driver menu (for example the I-jet menu).
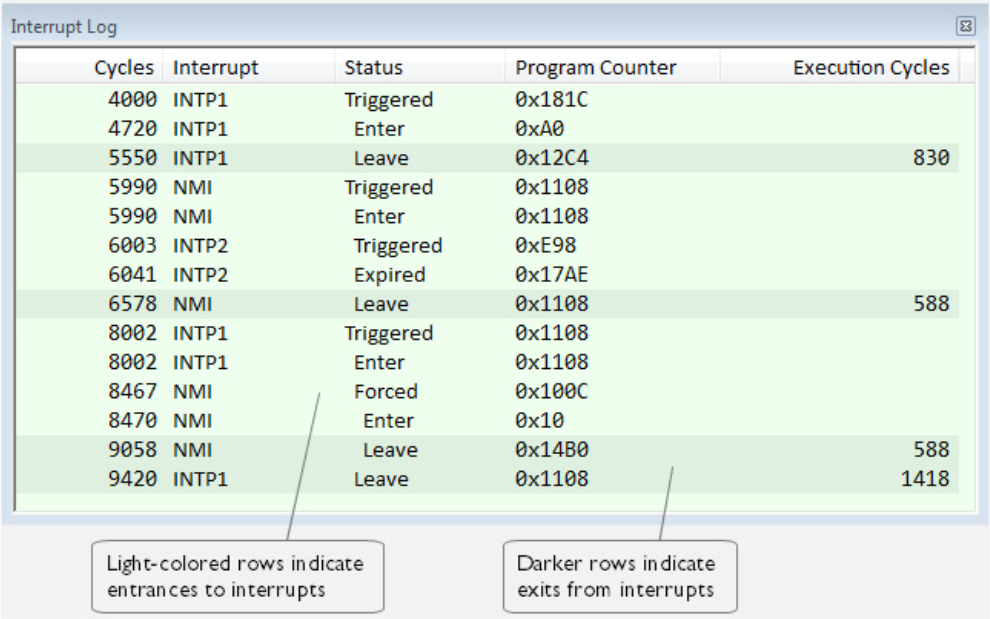
The interrupt log feature, shown below, allows you to see a log of the execution of interrupt handlers and how long each one takes to execute.

To enable logging, right click in the interrupt log and select enable. Click “Go” in the debug menu and this data will be captured in real time. The timestamp information is available either as a real-time figure or in CPU clock cycles.
It is also possible to save this information to a file for future reference or external processing. To do so, right click in the interrupt log and select save to log file.
A summary of the interrupt log is also available:

Here, we can see the number of times that each interrupt has been triggered, as well as statistics on the length of time taken to execute the ISR.
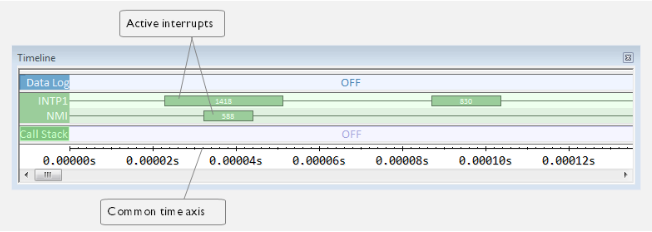
It is also possible to see the interrupt log info graphically in the timeline window:

This view allows us to see a graph of when each ISR was active and compare it to other ISRs as well as correlate to other timed activities such as data log breakpoints.