Mastering stack and heap for system reliability
The stack and the heap are fundamental to an embedded system. Setting up the stack and the heap properly is essential to system stability and reliability. Incorrectly used, they may cause your system to wreak havoc in the strangest ways.
Stack and heap memory must be allocated statically by the programmer. Calculating the stack space is notoriously difficult for all but the smallest embedded systems, and underestimating stack usage can lead to serious runtime errors which can be difficult to find. On the other hand, overestimating stack usage means a waste of memory resources. Worst case maximum stack depth is very useful information in most embedded projects, as it greatly simplifies estimates of how much stack an application will need. Heap memory overflows gracefully but this is of no real comfort as few embedded applications are able to recover in such extreme out-of-memory conditions.
A short introduction to stack and heap
Scope
The focus in this article is on reliable stack and heap design, and how to minimize stack and heap in a safe way.
Desktop systems and embedded systems share some common stack and heap design errors and considerations, but differ completely in many other aspects. One example of a difference between these environments is the available memory. Windows and Linux default to 1 and 8 Mbytes of stack space; a number that can be increased even more. Heap space is only limited by the available physical memory and/or page file size. Embedded systems, on the other hand, have very limited memory resources especially when it comes to RAM space. There is clearly a need to minimize stack and heap in this restricted memory environment. Common to small embedded systems is that there is no virtual memory mechanism; allocation of stack, heap and global data (i.e. variables, TCP/IP, USB buffers, etc) is static and performed at the time when the application is built.
We will address the special issues that arise in small embedded systems. We will not cover how to protect the stack and heap against attacks. This is a hot topic on desktop and mobile devices and is likely to be a threat to embedded systems as well in the future, if it isn’t already.
Stretching the limits
Stretching the limits in everyday life can sometimes be rewarding but can also put you in trouble. Stretching the limits in programming when it comes to allocated data will definitely put you in trouble. Luckily, the trouble may hit you directly or during system testing, but it might also manifest itself when it is too late and the product has been delivered to thousands of customers or deployed in a remote environment.
Overflowing allocated data can occur in all three storage areas; global, stack and heap memory. Writing to arrays or pointer references can cause accesses outside of the memory allocated to the object. Some array accesses can be validated by static analysis, for example by the compiler itself or a MISRA C checker:
int array[32];
array[35] = 0x1234;
When the array index is a variable expression, static analysis can no longer find all problems. Pointer references are also hard to trace by static analysis:
int* p = malloc(32 * sizeof(int));
p += 35;
*p = 0x1234;
Runtime methods to catch object overflow errors have been available for desktop systems for a long time, Purify, Insure++, and Valgrind, to name a few. These tools work by instrumenting the application code to validate memory references at runtime. This comes at the price of slowing down application execution speed dramatically and increasing code size, and has thus not become a usable method for small embedded systems.
Stack
The stack is the memory area where a program stores, for example:
- local variables
- return addresses
- function arguments
- compiler temporaries
- interrupt contexts
The life span of variables on the stack is limited to the duration of the function. As soon as the function returns, the used stack memory will be free for use by subsequent function calls.
Stack memory has to be allocated statically by the programmer. The stack usually grows downwards in memory and if the memory area allocated for the stack isn’t large enough, the executing code writes to the area allocated below the stack and an overflow situation occurs. The area written to is usually the area where global and static variables are stored. So, underestimated stack usage can lead to serious runtime errors like overwritten variables, wild pointers, and corrupted return addresses. All of these errors can be very difficult to find. On the other hand, overestimating stack usage means a waste of memory resources.
We will highlight some methods that can be used to reliably calculate the required stack size and detect stack related problems.
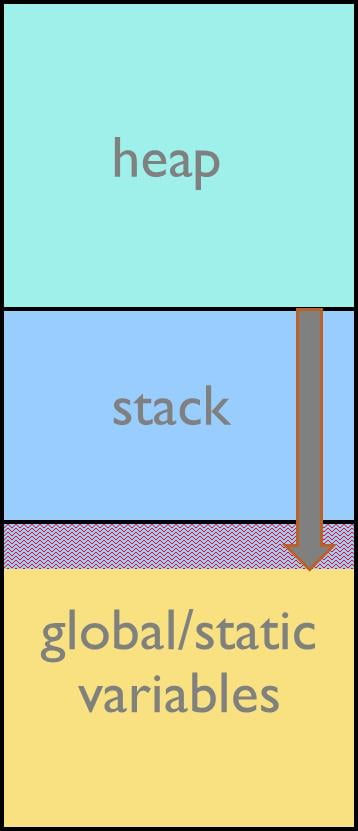
Figure 1: Stack overflow situation
Heap
The heap is where the dynamic memory of the system is located. Dynamic memory and the heap can in many cases be considered optional in small embedded systems. Dynamic memory makes memory sharing possible between different pieces of a program. When one module does not need its allocated memory anymore, it simply returns it to the memory allocator to be reused by some other module.
Some examples of data that is placed on the heap include:
- Transient data objects
- C++ new/delete
- C++ STL containers
- C++ exceptions
Calculating heap space ranges from difficult to impossible in larger systems, because of the dynamic behavior of the application. Moreover there is not much tool support in the embedded world for measuring heap utilization, but we will discuss some methods.
It is important to maintain heap integrity. Allocated data space is typically interspersed with critical memory allocator housekeeping data. Bad use of allocated data space will not only risk the corruption of other data space but may also corrupt the entire memory allocator and most likely crash the application. We will discuss some methods to aid checking for heap integrity.
Another aspect to consider is that the real-time performance of the heap is not deterministic. Memory allocation time depends on such factors as previous use and the requested data space size. This is hardly on the wish list for the cycle-driven embedded developer.
Even if the heap is a core topic in this article, the general guideline is to minimize heap usage in small embedded systems.
Reliable stack design
Why is calculating the stack so difficult?
There are many factors that make it difficult to calculate the maximum stack usage. Many applications are complex and event driven, consisting of hundreds of functions and many interrupts. There are probably interrupt functions that can be triggered at any time and if they are allowed to be nested, the situation becomes even more difficult to grasp. This means that there is not a natural execution flow that can be easily followed. There might be indirect calls using function pointers where the destination of the call could be a number of different functions. Recursion and un-annotated assembly routines will also cause problems for anyone who wants to calculate the maximum stack usage.
Many microcontrollers implement multiple stacks, for example a system stack and a user stack. Multiple stacks are also a reality if you use an embedded RTOS like µC/OS, ThreadX, and others, where each task will have its own stack area. Runtime libraries and third-party software are other factors that complicate the calculation since the source code for libraries and the RTOS may not be available. It is also important to remember that changes to the code and the scheduling of the application can have a large impact on the stack usage. Different compilers and different optimization levels also generate different code that uses different amounts of stack. Taken all together, it is important to continuously keep track of the maximum stack requirement.
How to set the stack size
When designing an application, the stack size requirement is one factor that needs to be considered, and you need a method for determining the amount of stack that you need. Even if you would allocate the entire remaining RAM for stack usage, you still cannot be sure it will be enough. One obvious approach is to test the system under conditions that produce worst-case stack behavior. During these tests you will need a method for finding out how much stack has been used. This can be done in basically two ways: from printouts of the current stack usage or by making sure that you can find traces of stack usage in memory after your test run has been completed. But as discussed above, in most systems the worst case conditions are very hard to provoke in a complex system. The fundamental problem with testing an event-driven system with many interrupts is that it is very likely that some execution paths will never be tested.
Another approach would be to calculate the theoretical maximum stack requirement. It’s easy to understand that calculating a complete system manually is impossible. This calculation will require a tool that can analyze the complete system. The tool must operate either on the binary image or the source code. A binary tool works at the machine instruction level to find all possible movements of the program counter through your code, to find the worst case execution path. A source code static analysis tool will read all the compilation units involved. In both cases the tool must be able to determine direct function calls and indirect function calls through pointers in the compilation unit, computing a conservative stack usage profile across the entire system for all call graphs. The source code tool also needs to know the demands the compiler places on the stack, such as alignments and compiler temporaries.
Writing this kind of tool yourself is a difficult task, but there are commercial alternatives, either stand-alone static stack calculation tools or one provided by the solution vendor, like the stack calculation tool that is available for Express Logic’s ThreadX RTOS. Other types of tools that have the information needed to calculate the maximum stack requirement are the compiler and the linker. This functionality is available for example in IAR Embedded Workbench for ARM. We will now look at some methods that can be used to estimate the stack size requirement.
Different methods to set the stack size
One way of calculating the stack depth is to use the address of the current stack pointer. This can be done by taking the address of a function's argument or local variable. If this is done in the beginning of the main function and for each of the functions that you think are using the most stack, you can calculate the amount of stack your application requires. Here is an example where we assume that the stack is growing from high to low addresses:
char *highStack, *lowStack;
int main(int argc, char *argv[])
{
 highStack = (char *)&argc;
 // ...
 printf("Current stack usage: %d\n", highStack - lowStack);
}
void deepest_stack_path_function(void)
{
int a;
lowStack = (char *)&a;
// ...
}This method can yield quite good results in small and deterministic systems, but in many systems it can be difficult to determine the nested function with the deepest stack usage and to provoke the worst case situation.
It should be noted that the results obtained with this method do not take into account stack usage by interrupt functions.
A variant of this method is to periodically sample the stack pointer using a high frequency timer interrupt. The interrupt frequency should be set as high as possible without impacting the real-time performance of the application. Typical frequencies would be in the range of 10-250 kHz. The advantage of this method is that there is no need to manually find the function with the deepest stack usage. It is also possible to find stack usage by interrupt functions if the sampling interrupt is allowed to preempt other interrupts. However, care should be taken as interrupt functions tend to be very short in duration and might be missed by the sampling interrupt.
void sampling_timer_interrupt_handler(void)
{
 char* currentStack;
 int a;
 currentStack = (char *)&a;
 if (currentStack < lowStack) lowStack = currentStack;
}
Stack guard zone
A stack guard zone is a memory area allocated just below the stack, where the stack leaves traces if it overflows. This method is always implemented on desktop systems where the operating system can easily be set up to detect memory protection errors for a stack overflow situation. On a small embedded system without MMU, a guard zone can still be inserted and be quite useful. For a guard zone to be effective, it must be of a reasonable large size, to catch writes to the guard zone.
The consistency checking of the guard zone can be made in software by regularly checking that the guard zone fill pattern is intact.
A better method can be implemented if the MCU is equipped with a memory protection unit. In that case, the memory protection unit can be set up to trigger on writes to the guard zone. If an access occurs, an exception will be triggered, and the exception handler can record what happened for later analysis.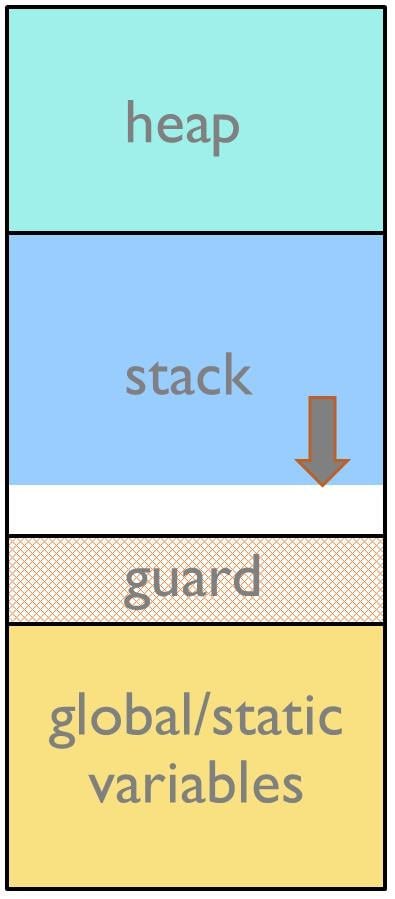
Figure 2: Stack with gard zone
Filling the stack area with a dedicated pattern
One technique to detect stack overflow is to fill the entire amount of memory allocated to the stack area with a dedicated fill value, for example 0xCD, before the application starts executing. Whenever the execution stops, the stack memory can be searched upwards from the end of the stack until a value that is not 0xCD is found, which is assumed to be how far the stack has been used. If the dedicated value cannot be found,, the stack has overflowed.
Although this is a reasonably reliable way to track stack usage, there is no guarantee that a stack overflow is detected. For example, a stack can incorrectly grow outside its bounds, and even modify memory outside the stack area, without actually modifying any of the bytes near the stack range. Likewise, your application might modify memory within the stack area by mistake.
This method of monitoring stack usage is commonly used by debuggers. This means that the debugger can display a graphical representation of the stack usage like in figure 3.The debugger does normally not detect a stack overflow when it happens, it can only detect the signs it leaves behind.

Figure 3: Stack window in IAR Embedded Workbench
Linker-calculated maximum stack requirement
We will now look closer on how build tools like a compiler and a linker can calculate the maximum stack requirement. We will use the IAR compiler and linker as an example for this discussion. The compiler generates the necessary information, and under the right circumstances the linker can accurately calculate the maximum stack usage for each call graph root (each function that is not called from another function, like the start of the application). This is only accurate if there is accurate stack usage information for each function in the application.
In general, the compiler will generate this information for each C function, but in some situations you must provide stack-related information to the system. For example, if there are indirect calls (calls using function pointers) in your application, you must supply a list of possible functions that can be called from each calling function. You can do this by using pragma directives in the source file, or by using a separate stack usage control file when linking.
void
foo(int i)
{
#pragma calls = fun1, fun2, fun3
 func_arr[i]();
}
If you use a stack usage control file, you can also supply stack usage information for functions in modules that do not have stack usage information. The linker will be able to generate warnings also if some necessary information is missing, for example under the following circumstances:
- There is at least one function without stack usage information.
- There is at least one indirect call site in the application for which a list of possible called functions has not been supplied.
- There are no known indirect calls, but there is at least one uncalled function that is not known to be a call graph root.
- The application contains recursion (a cycle in the call graph).
- There are calls to a function declared as a call graph root.
When stack usage analysis is enabled, a stack usage chapter will be added to the linker map file, listing for each call graph root the particular call chain which results in the maximum stack depth.
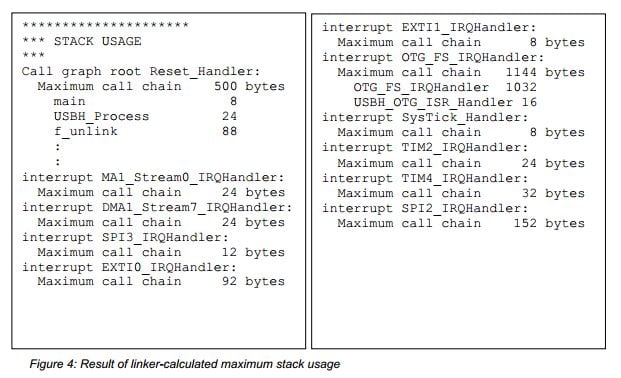
The total maximum stack usage for the complete system is calculated by adding together the result for each call graph root. In this analysis, the maximum possible stack usage will be 500+24+24+12+92+8+1144+8+24+32+152 = 2020 bytes.
It is important to remember that this type of stack usage analysis produces a worst case result. The application might not actually ever end up in the maximum call chain, by design or by coincidence.
Reliable heap design
What can go wrong?
Underestimating heap usage can lead to out of memory errors in malloc(). It is easily detected by checking the return status of malloc(), but then it will be too late. This is a serious situation, since in most systems there will be no acceptable way to recover; the only available response would be to restart the application. Overestimating heap usage is necessary due to the dynamic nature of the heap, but too large an overhead will waste memory resources.
Two other failures that can occur when using the heap are:
- Overwritten heap data (variables and pointers)
- Corruption of the heap’s internal structure
Before we continue, let’s recap the dynamic memory API.
void* malloc(size_t size);- allocates size bytes
- returns a pointer to the allocated memory block
- does not clear the memory block
- returns NULL if no memory is left
free (void* p);- frees the memory space pointed to by p
- requires p to have been returned by a previous call to malloc(), calloc(), or realloc()
- calling free(p) more than once for the same p must be avoided
void* calloc(size_t nelem, size_t elsize);- is similar to malloc()
- clears the memory block
void* realloc(void* p, size_t size);- is similar to malloc()
- grows/shrinks a previously allocated block
- the returned block might have a new address
C++- new operator – similar to malloc()
- new[]
- delete operator – similar to free()
- delete[]
There are a number of dynamic memory allocator implementations available. The most commonly used today is Dlmalloc (Doug Lea’s Memory Allocator). Dlmalloc is found in Linux and also in many development tools for embedded systems. Dlmalloc is freely available and placed in the public domain.
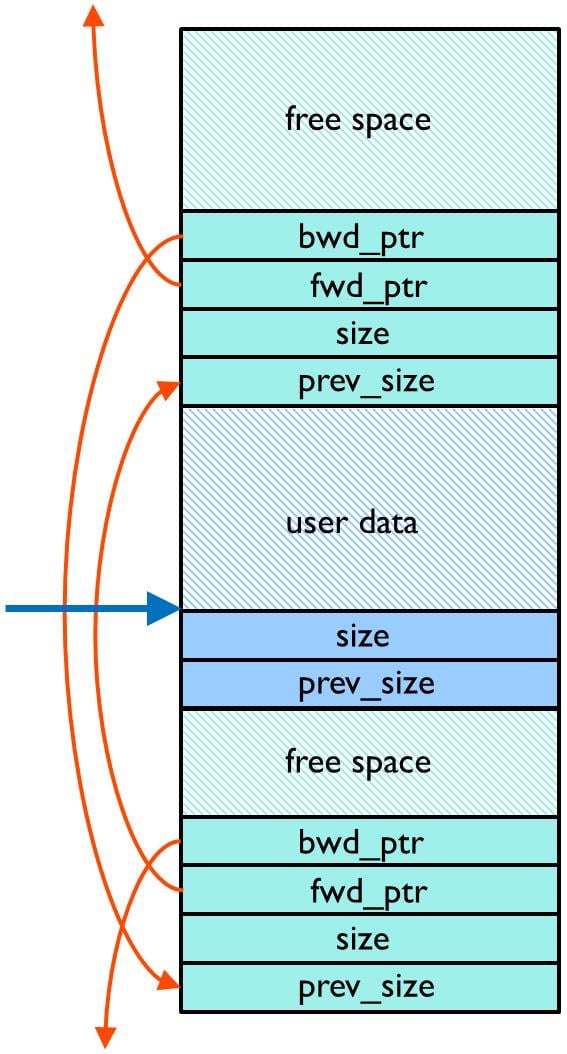
The internal structure for the heap is interspersed with data allocated by the application. If the application writes outside of the allocated data it might easily corrupt the internal structure of the heap.
Figure 5 shows a somewhat simplified view of how various data structures surround the allocated user data. It is quite obvious in Figure 5 that any write by the application outside the allocated user data will seriously corrupt the heap.
Calculating the amount of memory required for the heap is a non-trivial task. Most designers would go for a trial and error approach just because the alternatives are too tedious. A typical algorithm would be: find the smallest heap where the application still works, then add 50% more memory.
Preventing heap errors
There is a set of common errors that programmers and code reviewers should be aware of, to reduce the risk of launching products with heap errors.
• Initialization mistakes
Uninitialized global data is always initialized to zero. That well-known fact makes it easy to assume the same of the heap.Malloc(), realloc() and C++ new do not initialize the allocated data. There is a special variant of malloc() calledcalloc() that initializes allocated data to zero. In C++ new, the appropriate constructor will be called, so make sure it initializes all elements.
• Failure to distinguish between scalars and arrays
C++ has different operators for scalars and arrays: new and delete for scalars, new[] and delete[] for arrays.
• Writing to already freed memory
This will either corrupt the internal memory allocator data structures or be overwritten later by a write to a subsequently legitimately allocated area. In any case, these errors are really hard to catch.
• Failing to check return values
All of malloc(), realloc(), and calloc() return a NULL pointer to indicate out of memory. Desktop systems will generate a memory fault and out-of-memory conditions are thus easy to detect during development. Embedded systems may have flash at address zero and may survive with more subtle errors. If your MCU has a memory protection unit, you could configure it to generate a memory protection fault on write accesses to flash and other execute-only areas.
• Freeing the same memory multiple times
This is likely to corrupt the internal memory allocator data structures, and is really hard to detect.
• Writing outside of the allocated area
This is likely to corrupt the internal memory allocator data structures, and is really hard to detect.
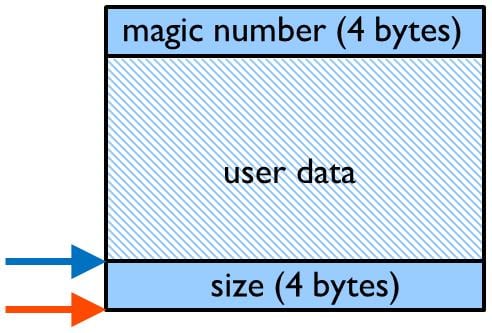
The last three errors are fairly easy to detect if you put wrappers around the standard malloc(), free() and related functions. The wrappers must allocate a few extra bytes of memory to accommodate the extra information needed for the consistency checks. The data layout in the example wrapper is shown in figure 6, the ‘magic number’ at the top is used to detect corruption and will be checked when the data is freed. The size field below the data is used by thefree() wrapper to find the ‘magic number’. The wrapper example uses 8 bytes of overhead per allocation, which should be acceptable for most applications. The example also shows how to override the C++ new and delete operators globally. This example will only catch all such errors if all allocated memory is also freed at some point in time. This may not be the case for some applications. In that case, the wrapper must maintain a list of all memory allocations and periodically validate all allocations recorded in the allocation list. The overhead of implementing this might not be as large as it sounds, since most embedded systems make relatively small use of dynamic memory, keeping the allocation list within a reasonable limit.
#include <stdint.h>
#include <stdlib.h>
#define MAGIC_NUMBER 0xefdcba98
uint32_t myMallocMaxMem;


void* MyMalloc(size_t bytes)
{
  uint8_t *p, *p_end;
  static uint8_t* mLow = (uint8_t*)0xffffffff; /* lowest address
returned by
                                                  malloc() */
  static uint8_t* mHigh; /* highest address + data returned by
malloc() */
  bytes = (bytes + 3) & ~3; /* ensure alignment for magic number */
  p = (uint8_t*)malloc(bytes + 8); /* add 2x32-bit for size and magic
number */
  if (p == NULL)
  {
    abort(); /* out of memory */
  }
  *((uint32_t*)p) = bytes; /* remember size */
  *((uint32_t*)(p + 4 + bytes)) = MAGIC_NUMBER; /* write magic number
after
                                                   user allocation */
  /* crude method of estimating maximum used size since application
start */
  if (p < mLow) mLow = p;
  p_end = p + bytes + 8;
  if (p_end > mHigh) mHigh = p_end;
  myMallocMaxMem = mHigh - mLow;
  return p + 4; /* allocated area starts after size */
}
void MyFree(void* vp)
{
  uint8_t* p = (uint8_t*)vp - 4;
  int bytes = *((uint32_t*)p);
  /* check that magic number is not corrupted */
  if (*((uint32_t*)(p + 4 + bytes)) != MAGIC_NUMBER)
  {
    abort(); /* error: data overflow or freeing already freed memory */
  }
  *((uint32_t*)(p + 4 + bytes)) = 0; /* remove magic number to be
able to
                                        detect freeing already freed memory */
  free(p);
}

#ifdef __cplusplus
// global override of operator new, delete, new[] and delete[]
void* operator new (size_t bytes) { return MyMalloc(bytes); }
void operator delete (void *p) { MyFree(p); }
#endif
How to set the heap size
How can we find the minimum heap size needed by the application? Because of the dynamic behavior and fragmentation that may occur, the answer is non-trivial. The approach recommended here is to run the application under a system test case that has been designed to force dynamic memory to be used as much as possible. It is important to repeatedly exercise transitions from low memory usage, to see the effects of possible fragmentation. When the test case is completed, the maximum usage level of the heap should be compared to the actual heap size. A margin of 25-100% should be applied, depending on the nature of the application.
For systems that mimic desktop systems by emulating sbrk(), the maximum heap usage will be given bymalloc_max_footprint().
For embedded systems that do not emulate sbrk(), it is common to give the entire heap to the memory allocator in one chunk. In that case malloc_max_footprint() becomes worthless; it will simply return the size of the entire heap. One solution would be to call mallinfo() after every call to malloc(), for example in the wrapper function described earlier, and observe the total allocated space (mallinfo->uordblks). Mallinfo() is computation-intensive and will have an impact on performance. A better performing method is to record the maximum distances between the allocated areas. This can easily be done and is shown in the wrapper example; the maximum value is recorded in the variable myMallocMaxMem. This method works provided that the heap is one contiguous memory area.
Conclusion
It is clear that setting up proper stack and heap areas is important for making an embedded system safe and reliable. Even if calculating the stack and heap requirements is a complex and difficult task, there are a number of useful tools and methods that can be used. The time and money spent on good calculation during the development phase is well rewarded just by not having to find problems related to overwritten stack and heap areas in a deployed system.
References
- Nigel Jones, blog posts at embeddedgurus.com, 2007 and 2009
- John Regehr ,“Say no to stack overflow”, EE Times Design, 2004
- Carnegie Mellon University , “Secure Coding in C and C++, Module 4, Dynamic Memory Management”, 2010