Using RTOS Diagrams
When designing an application (i.e. a product) using an RTOS, your job is to break this application into multiple tasks (a.k.a. threads), each responsible to handle a portion of your application. When I started using RTOSs, I learned about a technique to represent the relationship between tasks and ISRs using diagrams, similar to the one shown in Figure 1. These types of diagrams helped me provide an overall view of the application, and expose important interactions. In this article, I’ll share some of the concepts.

Figure 1, Interaction between tasks and ISRs in a Blood Pressure Monitor
The diagram is excerpted from the μC/OS-III book featuring medical applications and the Kinetis ARM Cortex-M4 MCU (ISBN 978-0-9823375-2-3). You can obtain a free PDF version of this book from the following web page https://www.weston-embedded.com/micrium-books or, purchase a hard copy from Amazon.com.
In this diagram, tasks are represented by circles, ISRs by ovals, external hardware by rectangles boxes and internal hardware to the MCU by rounded rectangles. The flow of information is also shown with arrows as well as some of the functions and variables used to perform the desired operations. The hourglasses represent timeouts on RTOS API calls or time delays (i.e. sleep). Additionally, you will notice numbers in parenthesis. These are used to refer to a textual description provided separately to explain the diagram. The amount of information you provide in this type of diagram is up to you. My philosophy is to provide as many details as you would like to have yourself, if you had to design the application based on this diagram.

For example, Figure 2 shows that you could include information such as the task name, priority and how much stack space you believe you’ll need for the task. Here, by convention, I placed the priority of the task above the task name and the stack size within square brackets below it. The square brackets are there to indicate that the stack is an array. In your first pass of such a diagram, you could (should) show the actual values of the task priority as well as stack size to give you an initial idea. This will allow you to get a good idea about how priorities are distributed and, how much stack space (and thus RAM) you’ll need. That being said, I prefer to represent stack-size in stack elements instead of bytes. A stack element could be 1 byte wide, 2 bytes, 4 bytes or 8 bytes depending on the CPU you are using. So, on a 32-bit CPU, [256] would represent 1024 bytes!

Figure 2, Representing a task (using magic numbers)
Eventually, you could replace those magic numbers with #define constants as shown in Figure 3. I’d further recommend using suffixes to the task name to identify the task code itself (i.e. NameTask()) and objects related to the task such as the TCB (i.e. NameTCB) and the task stack (i.e. NameStk[]). For example (assuming μC/OS-III):
#define NAME_TASK_PRIO 10
OS_TCB NameTCB;
CPU_STK NameStk[NAME_STK_SIZE];
void NameTask (void *p_arg)
{
// Task initialization
while (1) {
// Task Body
}
}

Figure 3, Representing a task (using identifiers)
Similarly, for ISRs, you could provide information such as the name of the ISR as well as its hardware priority and, the vector number associated with the interrupting device as shown in Figure 4. Again, once you have a good understanding of the whole application, you can replace those constants with #defines.

Figure 4, Representing an ISR
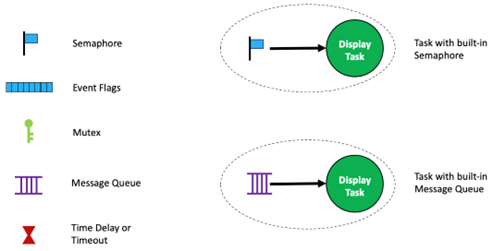
You can convey a lot more information if you also color code objects as I have done above with the task and the ISR. Figure 5 shows additional examples of RTOS objects you can use in your diagrams. Of course, the color scheme is optional and, if your RTOS offers additional objects, you will need additional icon:

Figure 5, Additional RTOS Objects
I generally start with large piece of paper, pencil and eraser to get an initial draft. Alternatively, you can use an iPad with Apple Pencil which can provide additional drawing and drawing capabilities. Initially, I just lay down the I/O devices, ISRs and tasks. As with electrical diagrams, inputs and ISRs go on the left and outputs on the right. Flows goes left to right and top to bottom. The text that goes with the diagram is created once you have a good understanding of your application and is used to complement the diagram.
It's important to strike a balance between too many details and just enough. As you do more of these, you’ll get a feel of what is optimum for you and your team. Depending on the target audience (only yourself or your team) you might decide to use your hand drawn version as your documentation or pretty it up for longer term use. As simple as some of these may be, you’ll find yourself referring and possibly updating these diagrams as you write your code.
About the author
This article is part of a series on the topic of developing applications with RTOS.
Jean Labrosse, Micrium Founder and author of the widely popular uC/OS-II and uC/OS-III kernels, remains actively involved in the evolution of the uC/ line of embedded software.
Given his wealth of experience and deep understanding of the embedded systems market, Jean serves as a principal advisor and consultant to Weston Embedded Solutions helping to chart the future direction of the current RTOS offerings. Weston Embedded Solutions specializes in the support and development of the highly reliable Cesium RTOS family of products that are derived from the Micrium codebase.
You can contact him at [email protected].
